Loan Reporting Software & Dashboards
Transform complex loan data into actionable insights with Nortridge’s robust reporting tools and insight dashboards.
Schedule a Demo →
Powerful Reporting Tools for Smarter Loan Management
Nortridge combines robust reporting features and a visual loan management dashboard to help loan servicers track performance, monitor risk, and streamline operations.
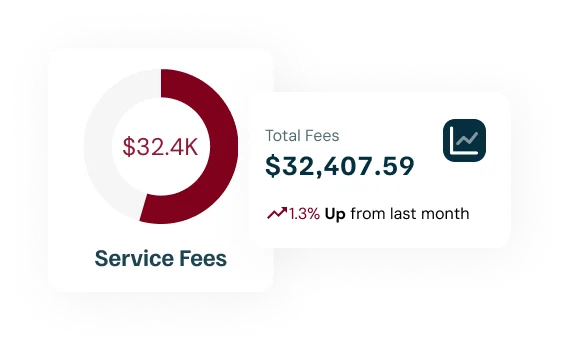
Loan Management Dashboard
Track loan growth, balances, and active accounts with configurable dashboards. Gain fast visibility into the health and performance of your loan portfolio, all in one view.
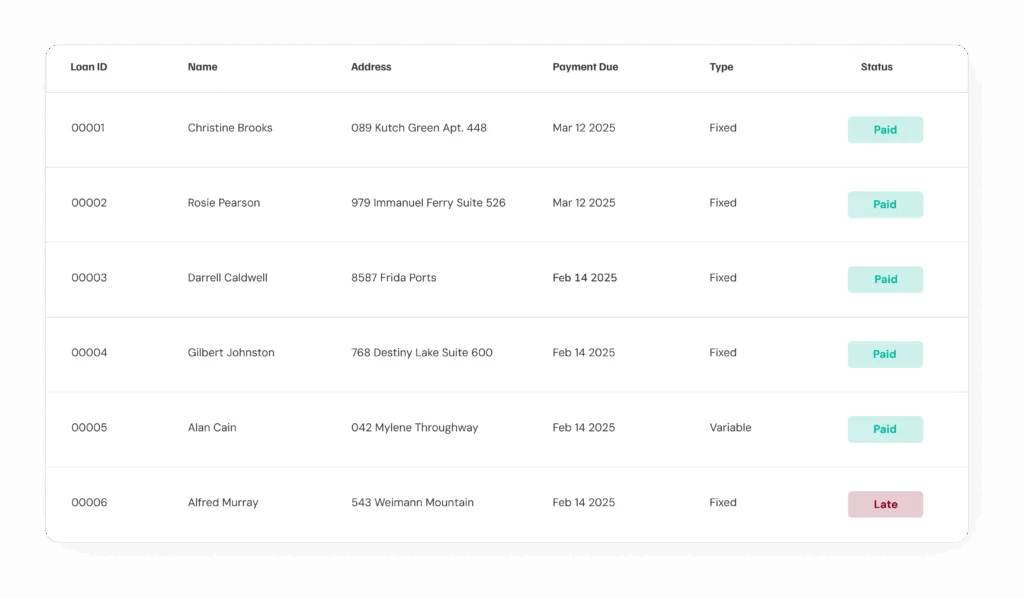
Statements, Late Notices & Document Control
Automatically generate borrower statements, payment coupons, and notices in various formats. All documents are stored and archived for easy retrieval and comprehensive audit trails.
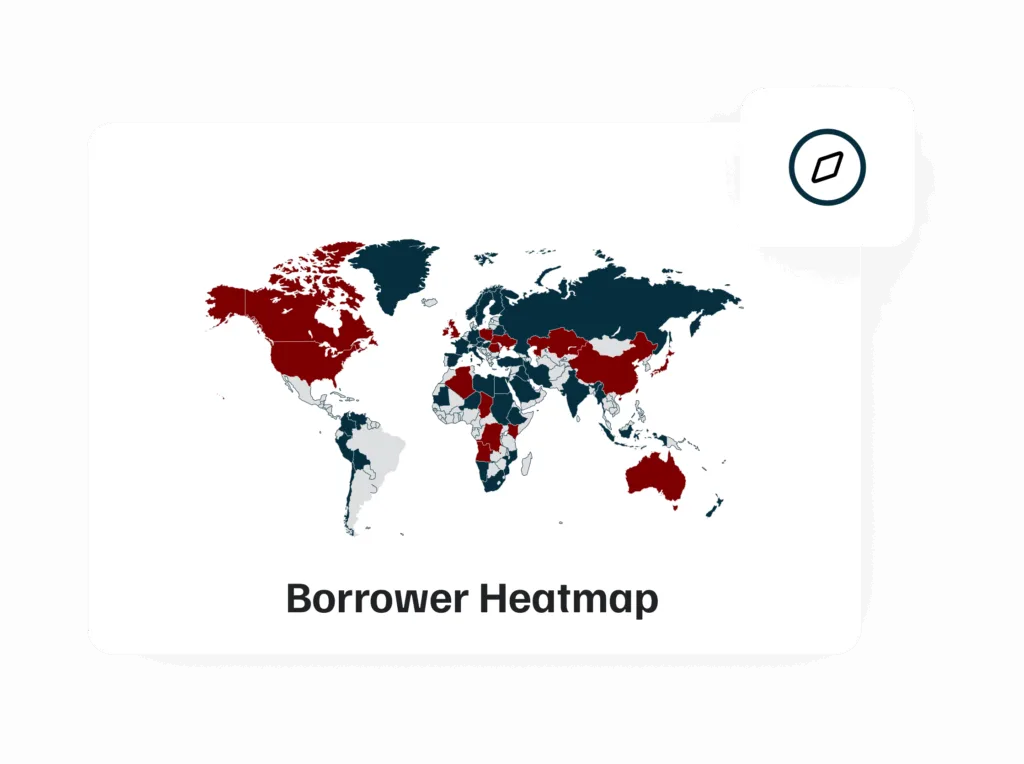
Visualize Delinquency Trends
Stay ahead of risk with dashboards that track delinquency status by region, average days past due, and collection performance to support proactive strategies.
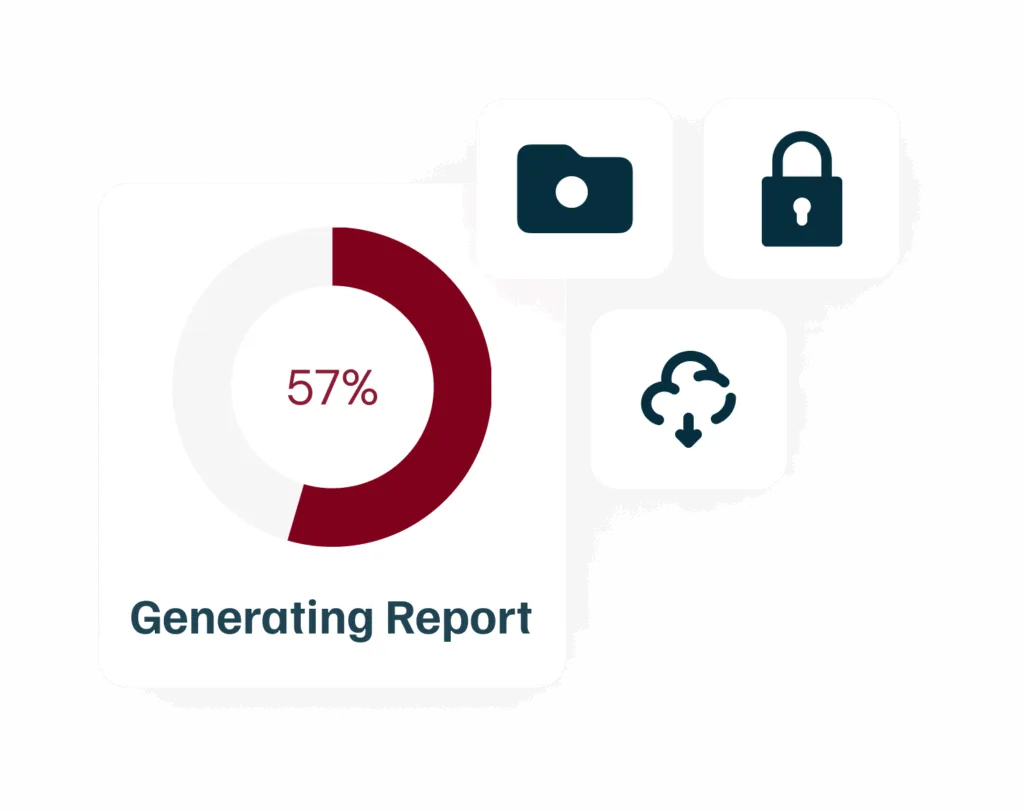
Streamlined Data Management
Access your complete loan database with direct connectivity options. Generate the exact reports you need while maintaining full control over your data.
Print & Mail Integration
Manage borrower communications efficiently with integrated MailSource print and mail services. Features NCOA validation, IMb tracking, and competitive pricing built into the platform.
Frequently Asked Questions
How many reports does Nortridge offer?
Can I build custom reports and dashboards?
Can I export reports and dashboards?
Does Nortridge handle borrower statements?
What data analysis capabilities are available?
Our Latest Testimonials
Read the latest from lenders and loan servicers using Nortridge to power their lending operations
There is no other solution that brings the out-of-the-box functionality as well as securing future growth with an extensible platform that is evolving and growing to meet future challenges and opportunities.
Allan Hill
Avid Financial
Flexibility with customizations and making the software fit your business needs. Nortridge Support Staff are always knowledgeable and timely with responses.
Carolyn Smith
Credit Central
Software includes a lot of functionality which, if we can use effectively, makes it replace the need for multiple software programs.
Deborah Temple
Communities Unlimited
Why Loan Servicers Choose Nortridge
Lenders and loan servicers trust Nortridge for its powerful, fully configurable loan management software. Our platform supports a wide range of loan types and offers advanced tools for automation, compliance, borrower communication, and performance reporting.
Whether you’re managing consumer loans, commercial lending, or specialty finance, Nortridge adapts to your exact needs, not the other way around. With 40+ years of experience and over $750 billion in active loans managed, we provide the reliability and expertise you need.
Our loan manager software delivers end-to-end lifecycle management with configurable workflows, seamless integration capabilities and comprehensive reporting tools that support your growth.